Light Meters
Versus
The Human Eye
The health department came to my work for a
routine inspection. We were assigned a new inspector. It has been
my experience over the past that each inspector has a different area
they are more concerned with. This inspector happened to be very
interested in getting the lighting in the work areas up to the 50
foot-candle rating the health codes called for.
Using the meter and talking with the inspector it
soon became apparent that some areas appeared better lit than others,
but registered lower on the light meter (foot-candles). This was
confusing since a candle power meter should measure the amount of light
and it should be that simple. The amount of light is the amount of
light right?
Not understanding why some areas appeared brighter
than others but were lower on the light meter’s reading bothered me.
That is why this is being written.
Kelvin
The Kelvin rating was something no one seemed to be able to
explain, other than quoting what they heard somewhere. For
example Kelvin refers to the color of the light, or Kelvin is a
temperature rating. In a way both of those statements are true.
Kelvin is a temperature scale similar to the Celsius scale. The
only difference between the two is what temperature is called
zero. Zero on the Kelvin scale is set at Absolute Zero (where
there is no molecular movement). Zero on the Celsius scale is
273.15 on the Kelvin scale and the increments per degree are the
same. Room temperature of 75°F would be 23.9°C or 297.04°K.
Kelvin to Celsius K = °C + 273.15
Fahrenheit to Celsius F = 1.8(°C) + 32
It is not uncommon for a fluorescent light to have a Kelvin
rating of 3500K. If you convert 3500K to Fahrenheit you would
get 5840°F. I know light bulbs are normally hotter than room
temperature when operating but I have never heard of one
reaching over 5,000°F! Obviously a lights Kelvin rating is not
referring to its operating temperature.
To understand what the Kelvin rating of a light means we need to
learn what a “Black Body” is. Bear with me while I go over a
couple things that will help understand what a Black Body is.
Light hitting an object can be absorbed or reflected by an
object depending on what the object is made of. Light can also
pass right through it in the case of most gases. The material
an object is made of determines how much light is absorbed and
how much is reflected. Reflected light can change the color an
object appears to be. For example if you shine a blue light on
a piece of paper the paper will take on a bluish color.
Light can be emitted by an object as well. When an object is
heated it begins to emit energy, the hotter it gets the shorter
the wave length gets (the frequency increases). When enough
heat is present the frequency is high enough that the energy
becomes visible to the human eye (light). This is why iron
starts to glow when you heat it. The material an object is made
of determines how much energy is emitted at a given temperature
and the frequency distribution of that energy.
Different materials will glow different colors at the same
temperature. The different materials will have different
wavelengths of peak energy radiation and will appear to be
different colors. The color they appear to be can also be
affected by the surrounding light since they will reflect some
of the light energy they receive.
A black body is a theoretical object that is a perfect absorber
so no energy is reflected back and the object appears black,
that’s where the name black body came from. It is also a perfect
emitter meaning it will emit the maximum amount of energy at any
given temperature, which is referred to as the black body
radiation.
When a black body or any other material is at absolute zero
there is no molecular movement and therefore no energy being
radiated. A black body at any temperature above absolute zero
emits energy, at ALL wavelengths. Although ALL wavelengths are
being emitted there is a peak of energy at one particular
wavelength and the wavelengths around it. A black body radiation
curve shows how much energy will be emitted at each wavelength
by a black body at a given temperature. Each temperature has
its own black body radiation curve that will show how much
energy is radiated at each wave length and what the peak
wavelength is. As the temperature of the black body increases
the wavelength of its peak output decreases (frequency
increases). When a black body is hot enough the peak out put is
in a frequency range that is visible to the human eye (light).
Since the human eye sees different wavelengths of light as
different colors, different temperatures of a black body would
appear as different colors. So a color can be directly related
to a temperature. A black body radiation curve shows that a
black body does not emit a peak of energy at just one
wavelength. There is a range of wavelengths it will emit with
the peak in the center of that range. So the black body may not
appear to be a particular shade of red or blue or green etc.
Instead it can look like white light but with a blue or red or
green tinge to it. Candle light is around 1,800K, normal day
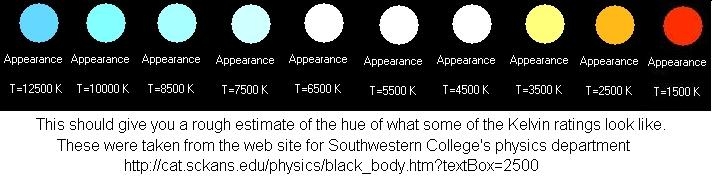
light is around 5,600K and the Kelvin scale goes up to 28,000K.
The temperature scale used when talking about the temperature of
a black body is the Kelvin scale. The Kelvin rating for a light
refers to the overall color the light will appear to have. A
light with a 2400K rating means the light would appear to have
the same color as a black body would at 2400°K. The Kelvin
rating of a light is also referred to as its color temperature.
Higher color temperatures are bluer in color while lower color
temperatures are redder in color.
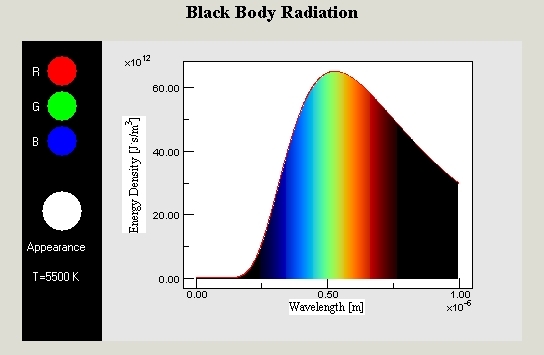
Here is the Black Radiation Curve for 5500K. These pictures were
taken from a web page for Southwestern College’s physics
department.
http://cat.sckans.edu/physics/black_body.htm?textBox=2500
The Kelvin rating of a light bulb can
be misleading depending on the type of bulb. A black
body will radiate at ALL wavelengths. The amounts at each wave
length may be high or so low it is immeasurable but all wave
lengths are emitted from a black body. Incandescent lights and
the sun both represent a black body well in that ALL wavelengths
are emitted. With these types of light one can measure the
energy out put at two points in the light spectrum (normally
near red and blue) and calculate the Kelvin rating.
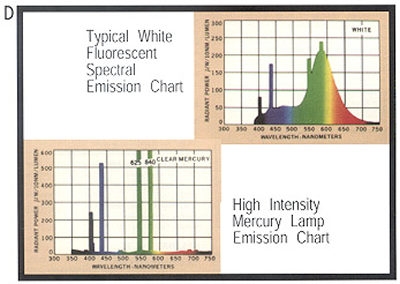
Fluorescent lights as well as all gas discharge style lamps do
not fit in this category. These have an interrupted spectrum.
Light is not emitted at all wavelengths. There can be sections
of the spectrum missing or there can be large spikes at various
wavelengths. Since the Kelvin rating refers to a black body it
does not accurately apply to fluorescent or gas discharge
lamps. In the past, lighting companies used to use the term
Apparent Color Temperature meaning that the color appeared to be
at a particular Kelvin but was in fact a little off, due to the
interrupted spectrum. This term was replaced with Correlated
Color Temperature (CCT) and soon lighting companies just used
the term Kelvin to refer to a lights apparent Kelvin rating.
This misrepresentation of Kelvin for fluorescent and discharge
style lamps is normally only a problem where accurate color
reproduction is needed like TV and photography. Objects will
not appear to have the same color under fluorescent lights or
gas discharge lamps as they do under incandescent lights or sun
light at the same Kelvin rating.
As the selection of lighting styles grow there are more lights
that have an interrupted spectrum and the term Kelvin is
somewhat miss leading. The term is still used since it helps
relate the apparent color in familiar terms used for
incandescent bulbs and day light.
The interrupted spectrum of a fluorescent light can make the
color of objects appear different. The lighting industry has a
rating called the Color Rendering Index (CRI). This index is an
indicator of how well the color reproduction of a light is. A
CRI of 100 means it will render colors the same as a light
source that does not have an interrupted spectrum that is rated
at the same Kelvin rating. A 4000K, 100CRI fluorescent bulb
would have objects appear the same color as an incandescent bulb
rated at 4000K. A CRI value of less than 100 would indicate
that the color objects appear would be different than an
incandescent with the same Kelvin rating. The CRI is calculated
by an average of 8 different colors. This means a bulb with a
high CRI say 85 would render most colors fairly accurately.
With a high CRI rating a bulb could still be missing a portion
of the spectrum that will make certain colors appear very
different from what they really are.
The picture below was taken from the website for the
International Cinematographers Guild
http://www.cameraguild.com/technology/kelvin.htm and shows
the typical spectrum of a fluorescent.
Light Output
Light output can be referred to in lumens, candle
power, candela, foot-candles and others. I started looking into the
ratings of each in an attempt to find conversions or at least and
understanding of the terms. The definitions of each of these terms are
fairly simple to understand if looked at individually. Trying to relate
one to the other or convert from one to another became a totally
different story. Some fall into the category of Radiance while others
fall into the category of Illuminance. And converting from one to
another is not always possible even though we think it should be based
on what the name is.
One worth pointing out is that candle power and
foot-candles are not the same thing. Candle Power is pretty much what
the name implies. It means that the light source is equal to that many
candles. Different candles will be brighter than others so a scientific
method for standardizing this has been established. Candle power is
something that measures the amount of light that a source emits and is
measured at the source.
A foot-candle is measured at the object being
lighted rather than at the source. It is a measure of how much light is
actually making it to the object. One foot candle is the amount of
light present one foot away from one candle. Increasing the distance
obviously decreases the amount of light and this happens as the inverse
square function.
Human Eye Response
When I was young I was taught about the two
portions of the eye that respond to light, rods and cones. The cones
allowed us to see color and worked well in brighter light while rods
worked well in low light levels and were pretty much a black and white
vision. I was taught the rods were less concentrated around the center
of the eye and that’s why you couldn’t see something well looking
straight at it in very low light conditions. The cones were not able to
function in the low light levels, so you could see better if you looked
off to the side in low light to see more with your rods.
There are almost no rods in the center of vision
and there are almost no cones in the peripheral vision. There is a zone
where rods and cones both exist and is called Mesopic vision.
The rods do not see red. That is why a red light
used at night does not interrupt your night vision as much as other
color light. If you use a red flashlight at night then turn it off your
eyes will still be adjusted to the darkness. The dilation of the pupils
is related to the Scotopic curve. This is why high pressure sodium and
fluorescent lighting can be bad on a person’s eyes. There may be an
absence of light at the wavelengths around the Scotopic curve. When
this is the case they pupils do not dilate and too much light is getting
in hurting the eyes. For this reason it is recommended to have an
incandescent light as a supplement in work areas where only fluorescent
lighting is used.
Picture taken from
http://www.guidetohometheater.com/features/204eye/index1.html
Turns out it is not just the amount of available
light it also has to do with the frequency of light. The cones in the
eyes respond better to a different frequency range of light than the
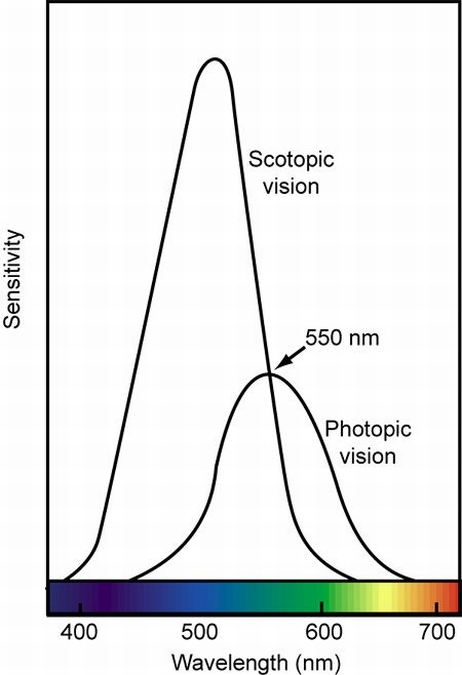
rods. The curve showing the cones response is called the Photopic curve
and the peak is around 555nm (around the yellowish orange portion of the
color spectrum). The curve for the rods is called the Scotopic curve
and its peak is around 507nm (around the greenish blue portion of the
color spectrum).
Light Meters
Most light meters are designed to measure the light
mostly around the peak of the Photopic curve. It was believed that the
Photopic curve was primarily what they human eye responded to in normal
lighting conditions.
Lights with interrupted spectrums like fluorescents
or gas discharge lamps can give inaccurate readings on some light
meters. For example, there could be a spike of light around the
wavelength the meter is most responsive to so it will give a higher
reading on the meter. On the other hand, there could be an absence of
light around the wavelength the meter is most responsive to and give a
lower reading. This is why some light meters have a setting for various
types of lighting like incandescent or fluorescent.
Recent research has shown that the rods are also
active during normal lighting conditions and do contribute to how bright
the light appears and how well we see. Most light meters are designed
to read mostly in the Photopic curve rather than taking both the
Photopic and Scotopic curves into account. For this reason one light
may appear brighter than the other but the meter will tell you it is
not.
This is where we return to the Kelvin rating. A
higher Kelvin rating means a shorter wavelength and therefore a higher
frequency. Since the peak of the Scotopic curve is at a higher
frequency, a higher Kelvin rating may appear brighter. The pupils
react to light with wavelengths near the Scotopic curve, lights with a
higher Kelvin rating may cause the pupils to dilate more and therefore
appear brighter.
Things are not always so simple though. A
fluorescent light with a higher Kelvin rating may appear brighter
because it produces more lumens in the Scotopic peak range. But at the
same time it may show higher or lower on a light meter. The fluorescent
light may have a spike or an absence of light around the peak of the
Photopic curve (where the meter is looking). This would have the light
meter show you a higher or lower reading depending on this spike or
absence. But your eye will also be responding to the peak in the
Scotopic curve which the light meter doesn’t see.
Lumens measured by the light manufacturers are
weighted toward the Photopic curve as well. Just looking at the lumen
rating of a light can give an incorrect representation of how bright the
light will appear. Currently lighting is rated based on the Photopic
curve so the specs can be misleading.
There are companies that make Photopic and Scotopic
light sensors. Lighting design professionals use light meters that
measure light in the Photopic and Scotopic ranges. These meters also
measure the ratio between the Photopic and Scotopic curves (S/P Ratio).
When the pupils are dilated further open they allow
more light in than is usually needed allowing aberrant rays to reach the
retina. Aberrant rays are rays let in by imperfections in the eye’s
lens that almost all people have. These aberrant rays cause blurred
vision. To dilate the pupils smaller a light that is brighter in the
Photopic region can be used. A more efficient way of dilating the
pupils is with lights that have more light in the Scotopic region where
the pupils react more. This can mean energy savings to a large
company. You get more perceived brightness and better working
conditions for less power. Using lights, of the same power level but
with more light in the Scotopic region, will increase the apparent
brightness and give better light for working conditions.
Natural day light has an S/P Ratio of about 2.5.
Lighting Specs
Looking at the S/P Ratio of a light can help
determine how well it will light an area as far as perception goes.
Scotopic divided by Photopic (S/P ratio).
Let’s look at two lights.
Light A
32W, 3500K, 3000 Lumens and an S/P ratio of 1.45
The efficacy (efficiency) of this bulb is 93.75
Lumens per watt. (3000/32=93.75)
Since lighting manufactures use the
Photopic curve this is the Photopic efficacy.
Using the S/P ration we get something different.
S/P ratio of 1.45 means we have 4350 Lumens in the Scotopic curve.
(3000*1.45=4350)
The Scotopic efficacy of this bulb is 135.9 Lumens per
Watt. 4350/32=135.9)
Light B
32W, 6500K, 2800 Lumens and an S/P ratio of 2.10
The efficacy (efficiency) of this bulb is 87.5
Lumens per watt. (2800/32=87.5)
Since lighting manufactures use the
Photopic curve this is the Photopic efficacy.
Using the S/P ration we get something different.
S/P ratio of 2.10 means we have 5880 Lumens in the Scotopic curve.
(2800*2.1=5880)
The Scotopic efficacy of this bulb is 183.75 Lumens per
Watt. 5880/32=183.75)
The lighting manufactures specs give ratings within
the Photopic curve, so light A is said to be more efficient. Light A
has 93.75 Lumens per watt while Light B has only 87.5 Lumens per watt.
Since light meters also measure light in the Photopic range, light A
will be the brighter light.
The human Eye uses the Scotopic range as well as
the Photopic range, so to the Human Eye Light B would be more
efficient. Light B has 183.75 Lumens per watt while Light A has only
135.9 Lumens per watt. Although light A would measure brighter on a
light meter the human eye would disagree. The human eye reacts to the
Scotopic curve as well and would see the difference.
While Light B would appear dimmer on a light meter
it would give better lighting for working conditions and strain the eyes
of people in the area less. This would mean better working conditions
for the same number of watts used.
I hope this spreads a little light (pun intended)
on why the meter appears to lie.
A helpful list of electrical terms can be found here
https://electricalschool.org/
Thanks to Adrian for letting me know about this list.
Sources:
- http://www.aquabotanic.com/lightcompare.htm
-
http://www.windows.ucar.edu/earth/Atmosphere/temperature/temp_scales.html
-
http://www.cameraguild.com/technology/kelvin.htm
-
http://galileo.phys.virginia.edu/classes/252/black_body_radiation.html
-
http://www.egglescliffe.org.uk/physics/astronomy/blackbody/bbody.html
-
http://cat.sckans.edu/physics/black_body.htm
-
http://www.lightsearch.com/resources/lightguides/formulas.html
-
http://www.theledlight.com/lumens.html
-
http://en.wikipedia.org/wiki/Photometry_%28optics%29
-
http://www.energy2002.ee.doe.gov/Presentations/Tech/S3-Richman2.pdf#search='scotopic%20lumens%20photopic'
- https://www.sylvania.com/en-us/innovation/education/light-and-color/Pages/color-characteristics-of-light.aspx
(updated link)
-
http://hyperphysics.phy-astr.gsu.edu/hbase/vision/rodcone.html#c5
-
http://www.instrumentationguide.com/article/photopic_sctopic.htm
-
http://ecom.mysylvania.com/miniapps/LightingCenter/PDFs/faq0016-0297.pdf#search='photopic%20scotopic%20curve'
-
http://www.guidetohometheater.com/features/204eye/index1.html
-
http://www.solar.com/spmeter.htm